

Article verified for Release 15.2 on March 4, 2026.
This article explains how to use automated reports to analyze question performance in tests and question pools. These reports help identify how candidates perform on specific questions by providing key metrics such as the success ratio (percentage of correct answers).
Using these insights, test managers can evaluate question quality, detect problematic questions, and improve overall test effectiveness. Reports can be viewed directly in the application, scheduled for automatic delivery, or downloaded as Excel files for further analysis.
Test reports
To navigate to the test reports, do the following:
- From the left-side menu, go to Tests > Manage test, then search for and select the desired test.
- Select the Reports tab.
- Clicking on the Open option in the Actions column to see the specific predefined report for the test that is selected.

Scheduling report for the test
To schedule a report, do the following:
- Select the Schedule report button.
- The report’s name is selected from the previous action (Open).
- Define the start time.
- Define the interval.
- Enter the email subject.
- Enter the email message.
- Define the subscribers who will receive the predefined report.
- Set the conditions for the predefined report.
- Click on the Save button to save the changes.

After the scheduled report is set, it will be delivered to the defined email address.
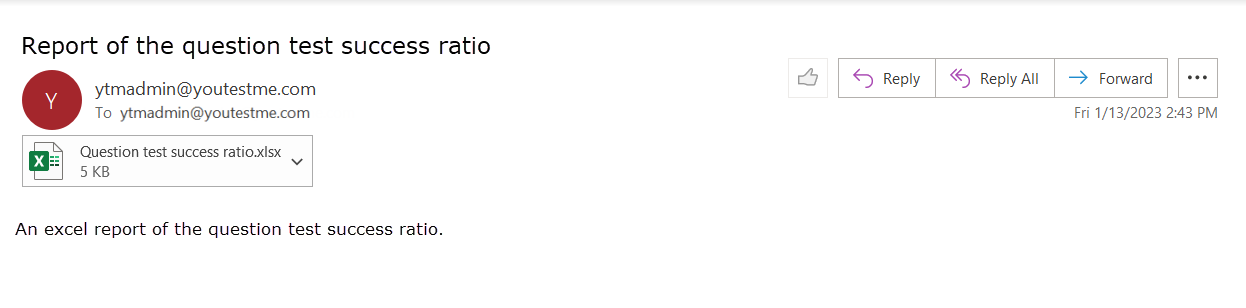
After downloading the Excel file, you will see which questions satisfy the conditions defined for the scheduled report.

Question pool reports
- Go to the Tests tab, open Question pools, and then search for the desired pool.
- Navigate to the Reports tab.
- Click the Show button in the Predefined report card.
- Search for the desired report and click the Open icon under the Action column.
Key insight: Success ratio
In question pool reports, you can view the success ratio, which represents the percentage of candidates who answered each question correctly.
This metric is essential for:
- Identifying overly difficult or overly easy questions
- Evaluating question quality
- Improving question pools based on candidate performance
- Ensuring balanced and fair tests

Please read the content under the previous title on how to schedule the report, or read this article for more information.
After receiving the email with the Excel spreadsheets, you can download them and see the following:
- Questions in the question pools that have feedback.

- Questions from the specific test that have feedback.

Note: Scheduled reports that are created for the tests and question pools can be found in the Reports/Scheduled reports tab and can be modified or deleted.