This article provides a comprehensive guide on conducting Item analysis using YouTestMe GetCertified. Item analysis allows you to assess the reliability and effectiveness of test questions.
There are three ways to conduct item analysis:
- Predefined Test Report – You can utilize the item reliability report provided by YouTestMe GetCertified. This report offers insights into the performance of each test question, allowing you to assess the reliability and effectiveness of the items.
- Report Builder – The platform also offers a report builder feature that enables you to download all the answers to the questions. With this downloaded data, you can perform item analysis independently, gaining more flexibility and control over the analysis process.
- Success ratio – Within YouTestMe GetCertified, you have access to the Question tab, where you can easily view the success ratio for each test question. This information helps you evaluate the difficulty level and effectiveness of individual items
Using predefined test reports #
To access the Item Reliability report, follow the next steps:
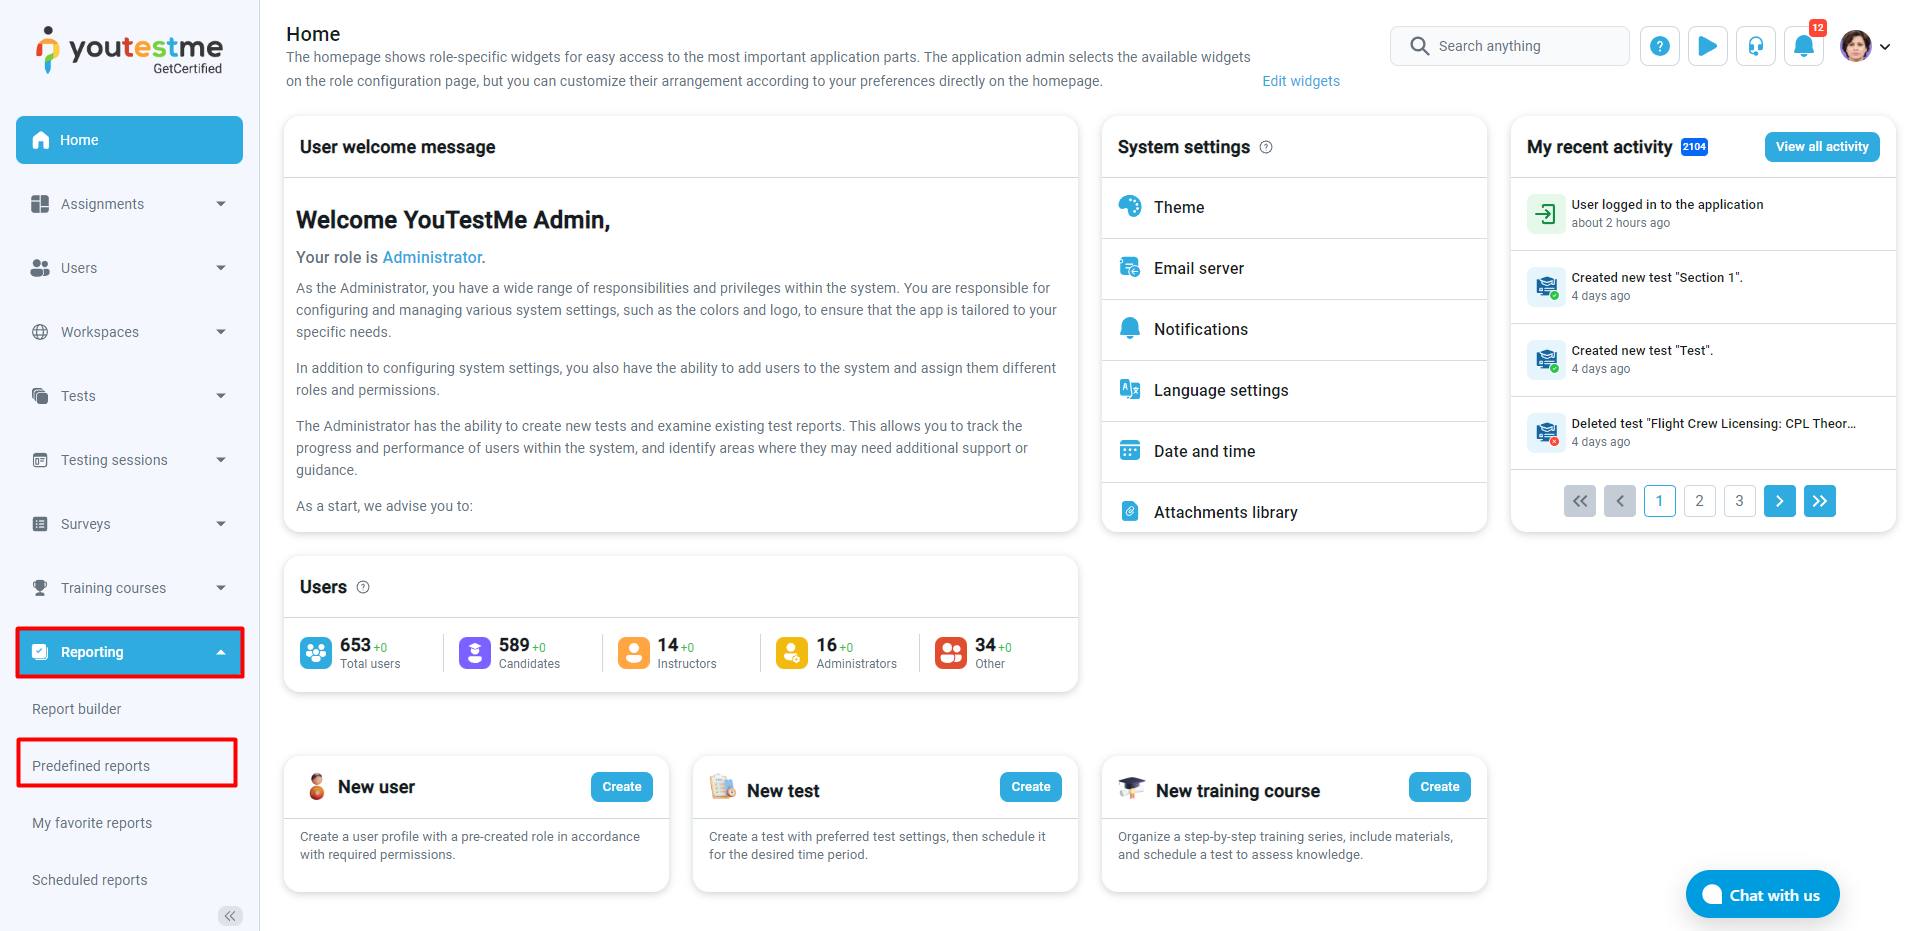
- Click the Reporting option in the main menu, and select Predefined reports.

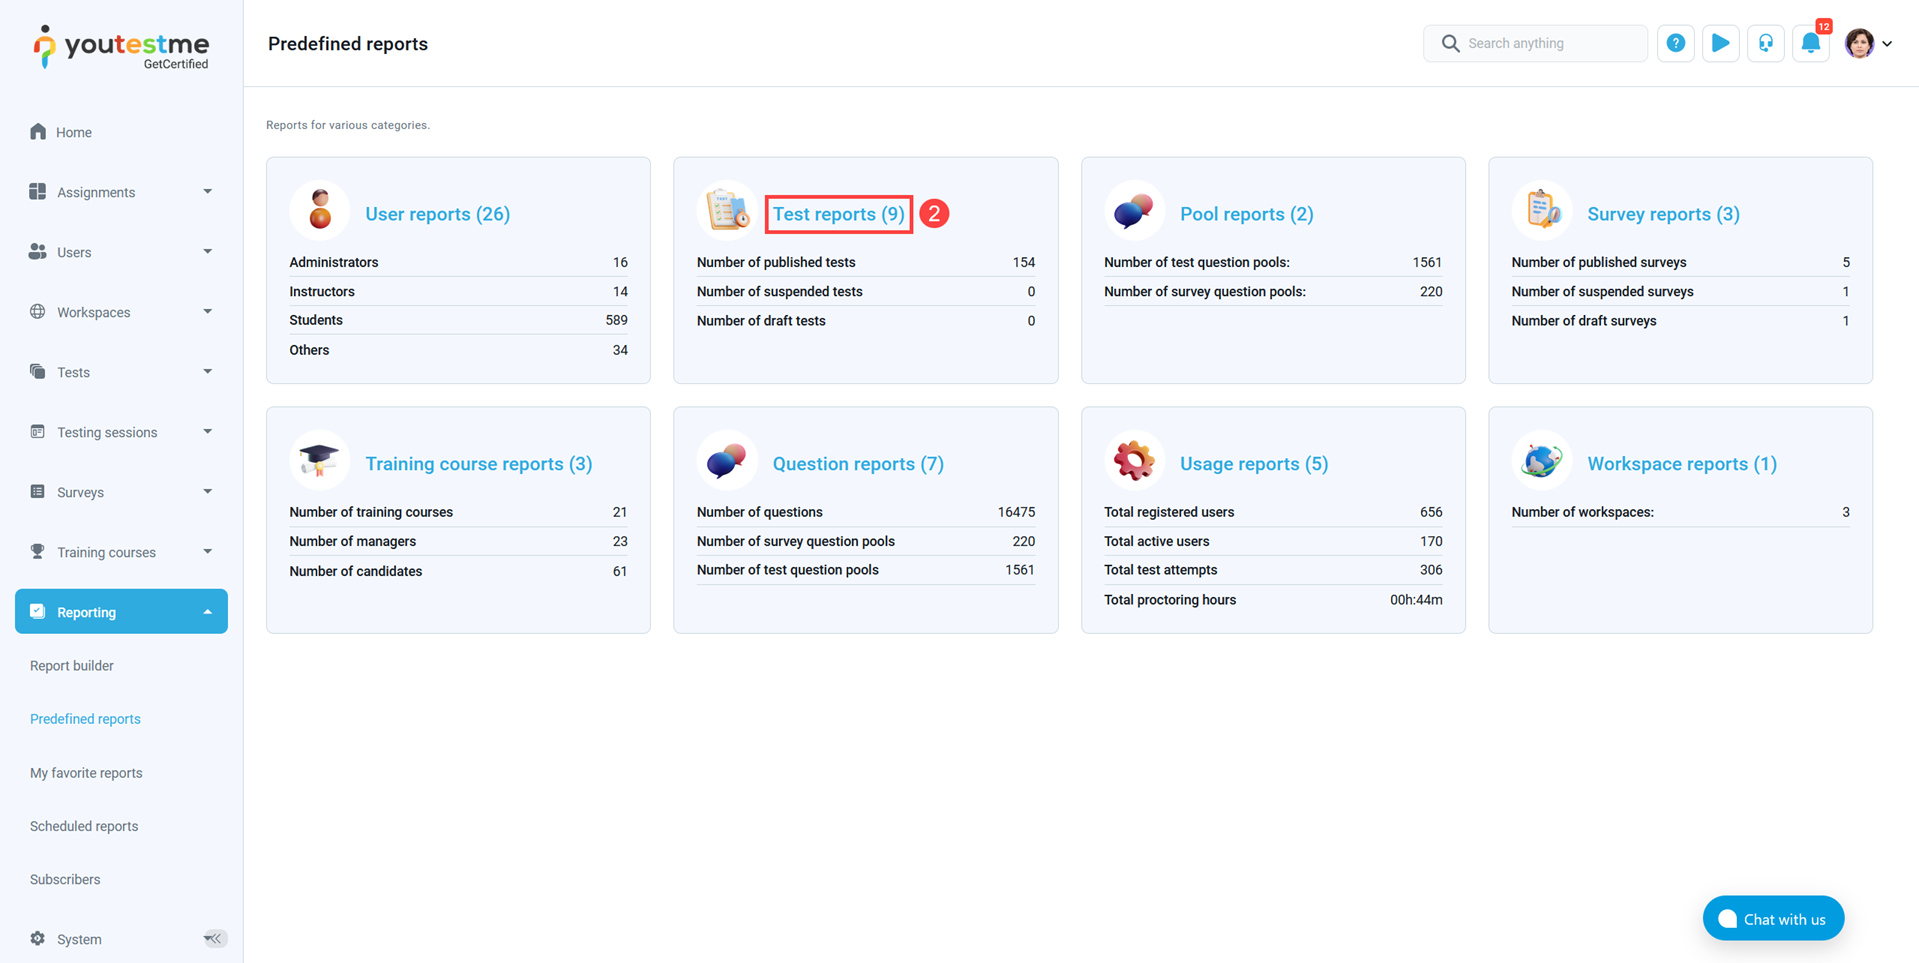
- Click on Test reports.

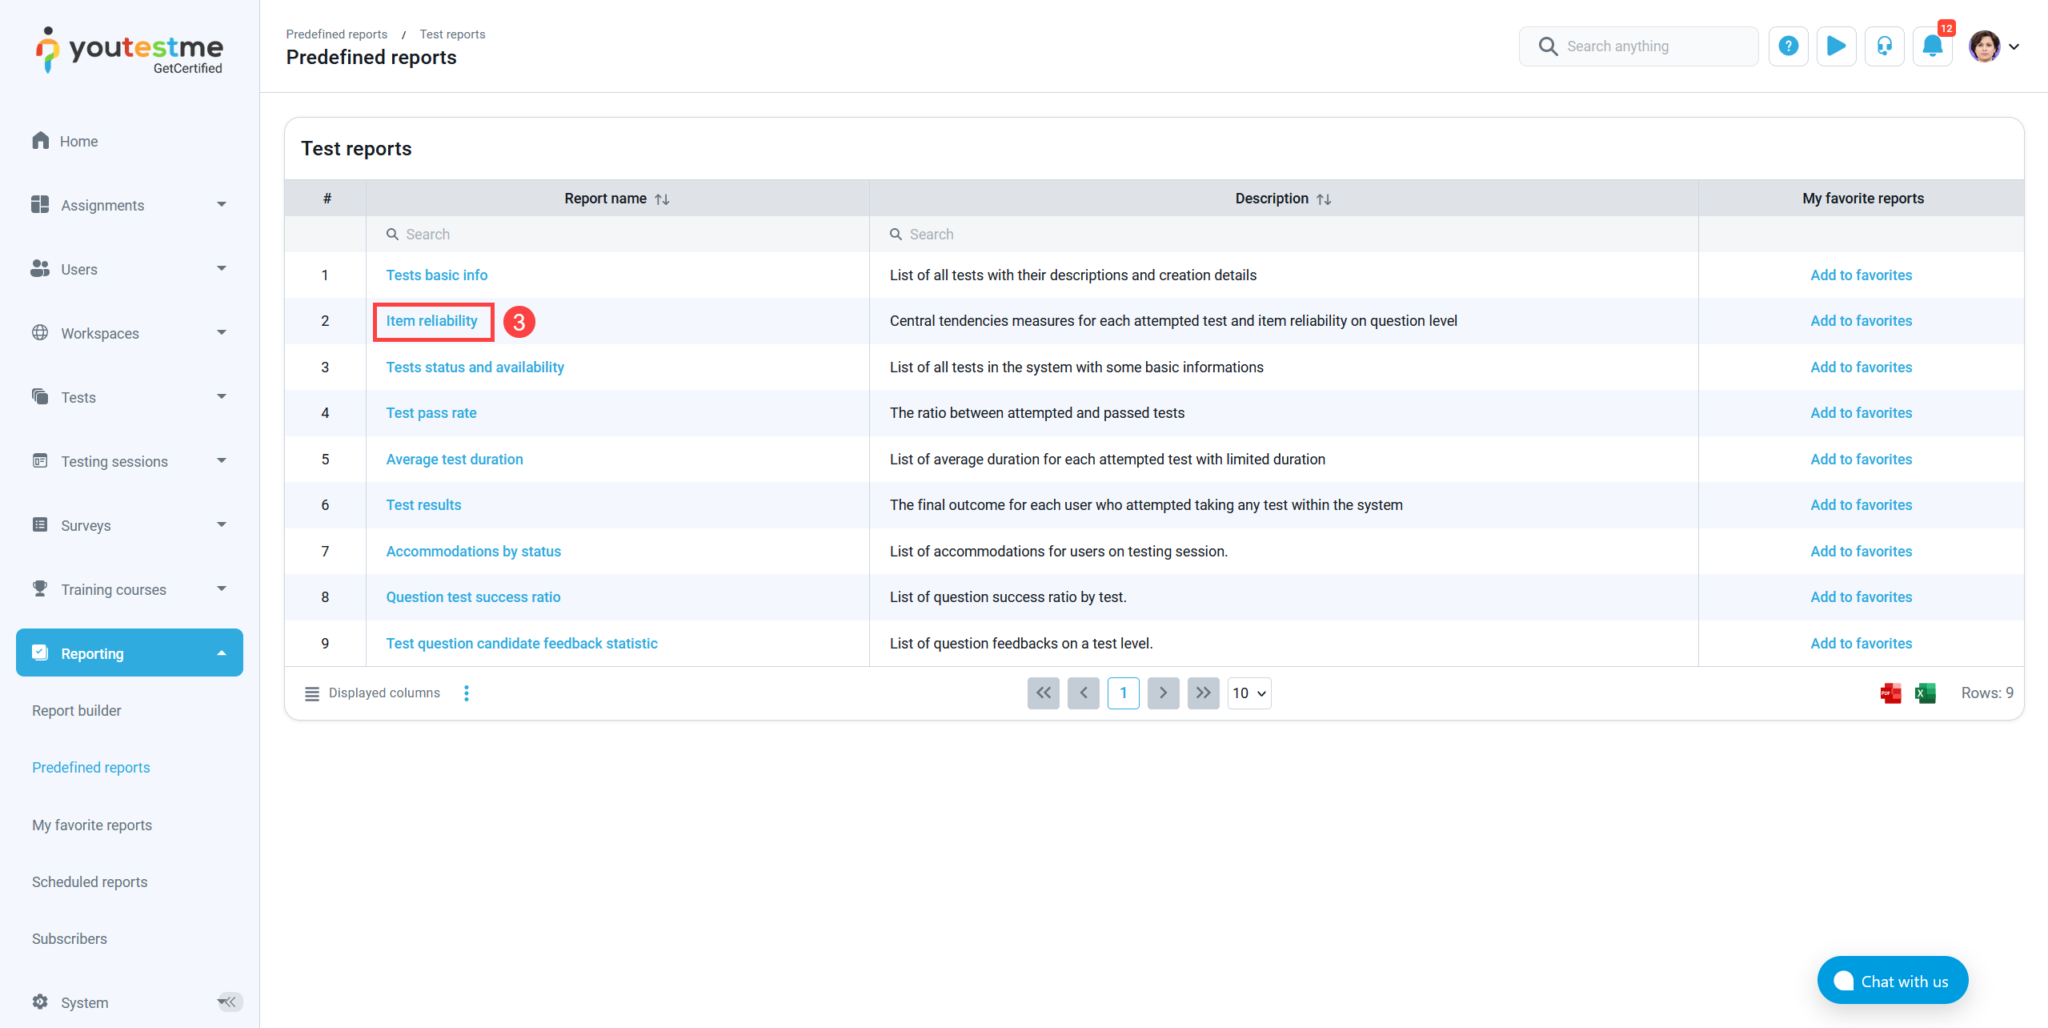
- Choose the Item reliability report.

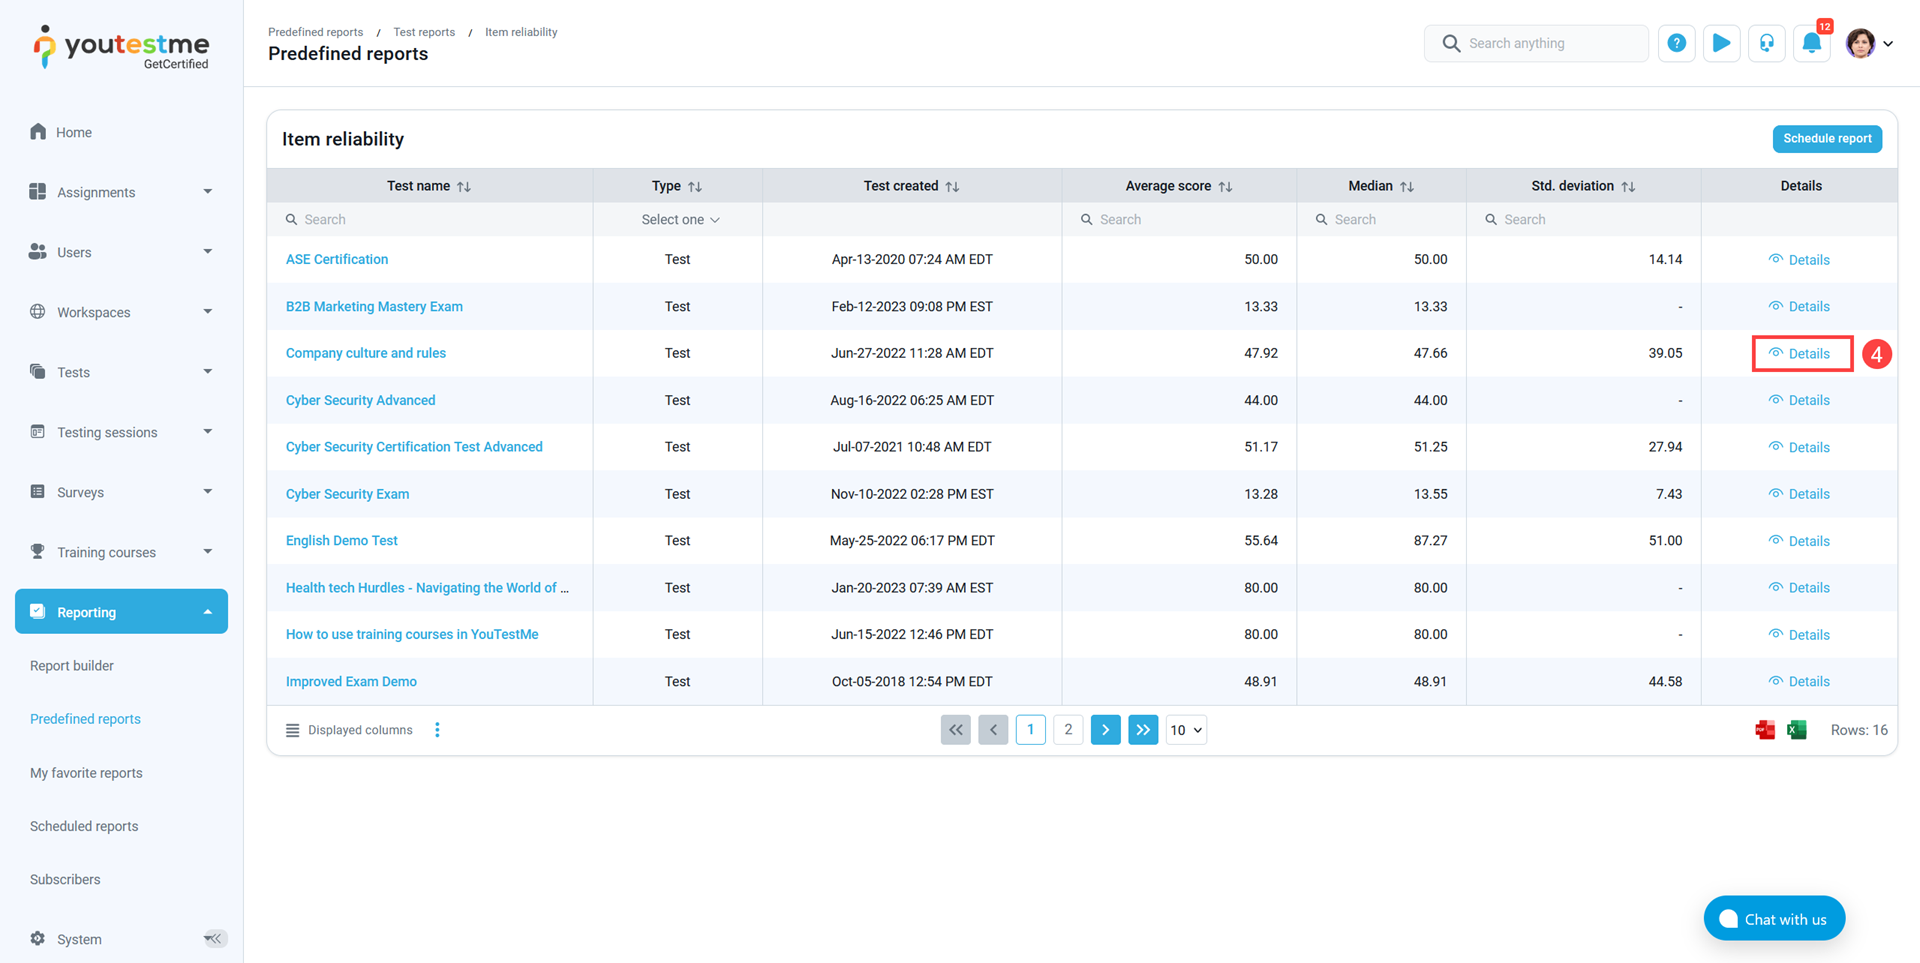
- Click the Details button to preview each question’s success ratio and item reliability.

On the displayed screen, there are the following metrics shown:
- The success ratio provides the percentage of candidates that answered the question correctly.
- Item reliability is based on point-biserial correlation and will let you know how items correlate with the test as a whole, allowing you to identify the questions that do not belong in a test. When determining the correlation between the item and the test as a whole, the system correlates the responses on that item (dichotomous variable – correctly or incorrectly answered) with the test’s outcome (continuous variable – the score on a test). The values can range between -1 and 1. Negative values usually mean that:
- Candidates that got lower scores on the exam answered this question correctly.
- Candidates that got higher scores on the exam answered this question incorrectly.
In this case, the question does not correlate with the exam, and you may want to exclude it from the next exam versions or substitute it. Positive values usually mean that:
- Candidates that got higher scores on the exam answered this question correctly.
- Candidates that got lower scores on the exam answered this question incorrectly.
In this case, the question correlates with the exam and should be included in the next exam versions.
- Standard deviation measures the variability of success ratios for individual questions, helping identify inconsistent performance and correlations between question difficulty and overall test scores
Note: The item reliability report shows manually created tests.
Using report builder #
To see more information on report builder, please read this article.
Using the success ratio #
To see the success ratio for each question:


